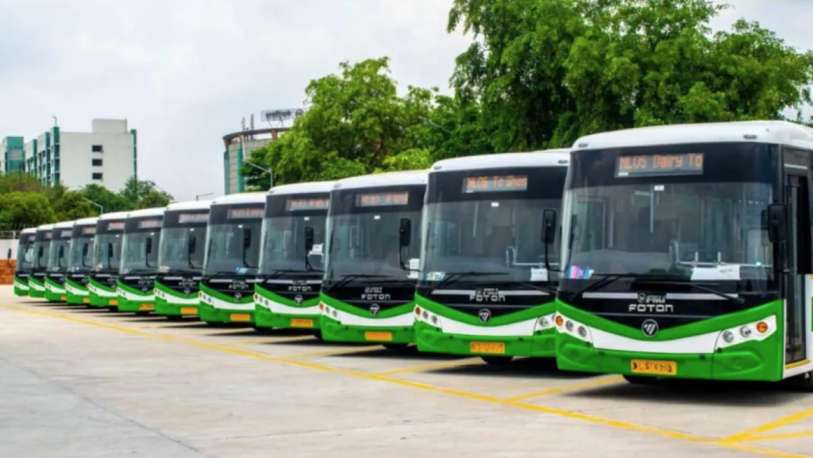
This is a dataset of Transport Demand Prediction which has more than 50000 data in which we have to predict how many seats MobiTicket can sell in each ride. This dataset contains 14 different routes going to the same location Nairobi with different timings and routes.
Transport Demand Prediction Routes Details
The journey from these 14 origin points to the first stop on the outskirts of Nairobi takes approximately 8 to 9 hours from the time of departure. From the first stop on the outskirts of Nairobi to the main bus terminal, where most passengers disembark, in the Central Business District, it takes 2 to 3 hours, depending on traffic. The three stops each of these routes make in Nairobi (in order) are:
Kawangware: First stop on the outskirts of Nairobi Westlands Afya Centre: The main bus terminal where most passengers disembark Passengers on these bus (or shuttle) rides are not only affected by Nairobi traffic during their journey in the city, but from there they must continue their journey to their final destination in Nairobi, wherever that may be. The traffic may act as a deterrent for those who have the option to avoid buses arriving in Nairobi during peak traffic hours. On the other hand, traffic can be an indication of people’s movement patterns, reflecting business hours, cultural events, political events, and holidays.
Unveiling the Dynamics of Transport Data: A Deep Dive into MobiTicket’s Journey
Unlocking the Mysteries of Mobility
In the bustling urban landscape of Nairobi, where time is of the essence, MobiTicket stands as a beacon of convenience in the realm of transportation. This digital disruptor has transformed the way people traverse the city, offering a predictive and streamlined approach to ticket sales. At the heart of this innovation lies a goldmine of insights – the Transport Data.
Understanding the Dataset of Transport Demand Prediction
The Transport Demand Prediction Data at our disposal is a comprehensive collection reflecting the demand for transport, comprising a whopping 51,645 rows and 10 columns. It serves as the pulse of MobiTicket’s operations, providing a unique perspective on the dynamics of commuting in Nairobi.
Journey Details of Transport Demand Prediction
The dataset encapsulates the journeys of commuters departing from 14 distinct origin points, converging on the outskirts of Nairobi. The initial leg of the journey spans 8 to 9 hours, culminating in the city’s central hub – the Central Business District. Navigating through three pivotal stops – Kawangware, Westlands, and Afya Centre – the dataset paints a vivid picture of the intricate web of travel within Nairobi.
Cracking the Traffic Code of Transport Demand Prediction
Nairobi’s notorious traffic becomes more than a mere inconvenience; it transforms into a trove of valuable information. The dataset unravels patterns embedded in the ebb and flow of people, reflecting not only peak traffic hours but also the rhythm of business, culture, politics, and holidays.
Transport Demand Prediction Dataset Variables
Let’s take a closer look at the key variables that shape this dataset:
- ride_id: A unique identifier for a vehicle on a specific route, day, and time.
- seat number: The assigned seat for a ticket, ensuring a seamless boarding process.
- payment method: Illuminating the diverse ways customers procure tickets – cash or Mpesa.
- payment receipt: A distinctive ID for each Mobiticket purchase, tracking transaction history.
- travel_date: The departure date, offering a chronological lens into ride schedules.
- travel time: Scheduled departure time, a critical element in MobiTicket’s punctuality.
- travel from: The origin town, signifying the diverse starting points of journeys.
- travel to: The ultimate destination – a common thread, all rides leading to Nairobi.
- car_type: Distinguishing between shuttle and bus, shaping the commuter experience.
- max_capacity: The vehicle’s seating capacity, a pivotal factor in predicting demand.
Problem Statement: Navigating Seat Sales
Amidst this sea of data, the challenge is crystal clear – predicting the number of seats MobiTicket can sell in each ride. An endeavor that blends the art of prediction with the science of analytics, aiming to optimize the commuting experience for every passenger.
Conclusion
As we embark on this journey through the intricacies of Transport Demand Prediction data, stay tuned for insights, revelations, and a deeper understanding of MobiTicket’s role in shaping Nairobi’s mobility landscape. The adventure has just begun, and the answers lie within the digits and details of the Transport Data. Get ready to decode the secrets of travel with us! 🚗💨 #MobiTicketInsights #TransportDataAnalysis #UrbanMobilityRevolution #TransportDemandPrediction
Click Here for Code
Transport Demand Prediction GitHub Link


